Invocation traces and request timelines
 Sean DubbFounder, Easel.sh
You can inspect how a function invoke moved through the platform with zoomable timelines, multiplexed request bars, and linked Traces in Invocations.
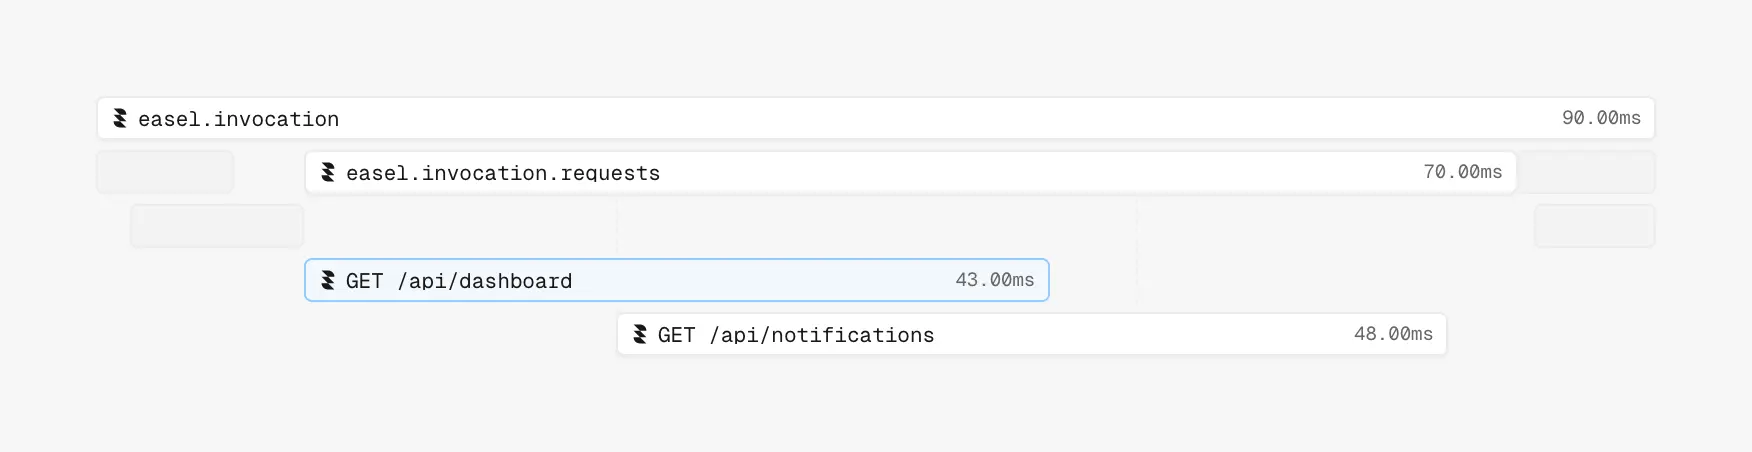
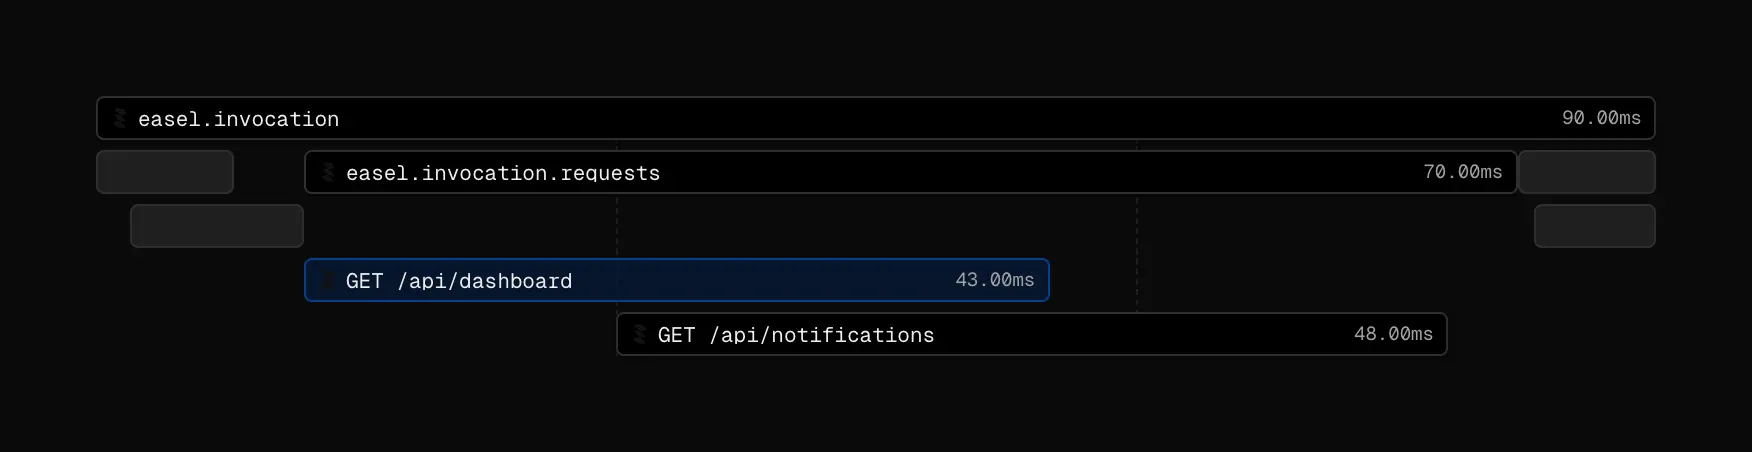
Invocation Trace with multiplexed request bars on one warm isolate
Timelines and multiplexed requests
Open an invocation from Invocations to see a zoomable timeline of function work. When one warm isolate serves concurrent requests, the Overview and Trace show those requests as separate bars on the same invoke.
Link from a Logs row into the matching invocation so you do not re-find the same event. Cold start and AWS billed stay on the detail metrics next to the Trace.
When traces help
Use traces after a deploy when p95 latency moves and charts alone do not explain why. Compare two invocations from before and after the release to see which span grew.
For a single request, open Logs, select the row, and use the Trace tab. Invocations adds the invocation-level Trace, multiplexed request bars, and links back into Logs when you need more depth.