See where every request spent its time.
Inspect traffic trends, request logs, platform spans, application OpenTelemetry, cold starts, and multiplexed function invocations in one place.
Find the latency before users report it
When latency or errors appear, teams need the platform path and their own instrumentation in the same timeline—not separate dashboards that never line up.
Platform spans cover routing and invoke. Application OpenTelemetry nests under the invoke when present. Provider duration and billed duration remain explicit invocation metadata rather than application trace spans.
Connect request and invocation
Toggle between the request you are debugging and the invocation that may have served multiple overlapping requests under Concurrent Functions.
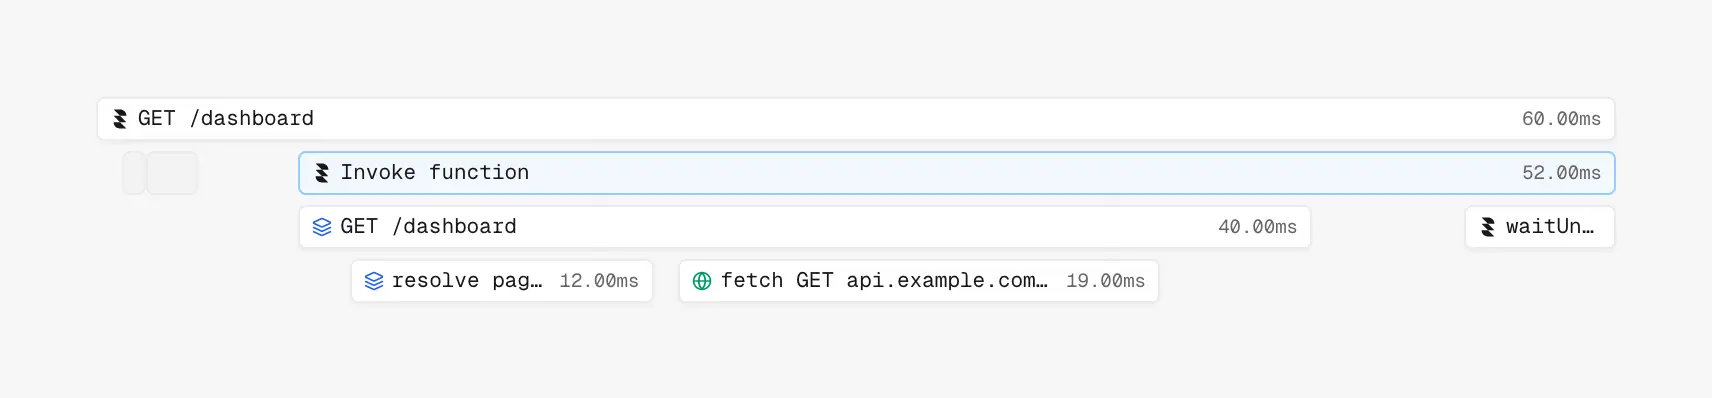
Request trace timeline for a single request in Logs
A debugging story
Checkout requests became 400 ms slower. Traffic charts show the p95 increase, filters narrow to the affected route, and the request trace separates cold initialization from database latency.
- 1.p95 latency rises on /api/checkout
- 2.Filter: status:5* region:IAD path:/api/checkout
- 3.Request trace: cold init vs database span
- 4.Invocation view: concurrent load on the warm runtime
Provider duration and billed duration remain explicit invocation metadata rather than being represented as application trace spans.
How Concurrent Functions relate to invocationsTrace your next preview
Deploy an app, send traffic, and open Observability on the deployment. Add OpenTelemetry in your runtime to deepen application spans.