Route breakdown in Edge Requests
 Sean DubbFounder, Easel.sh
Open Edge Requests in project Observability to see which routes carry your traffic. Below the charts, a table lists each route with the numbers you need to spot a cold cache or a failing endpoint.
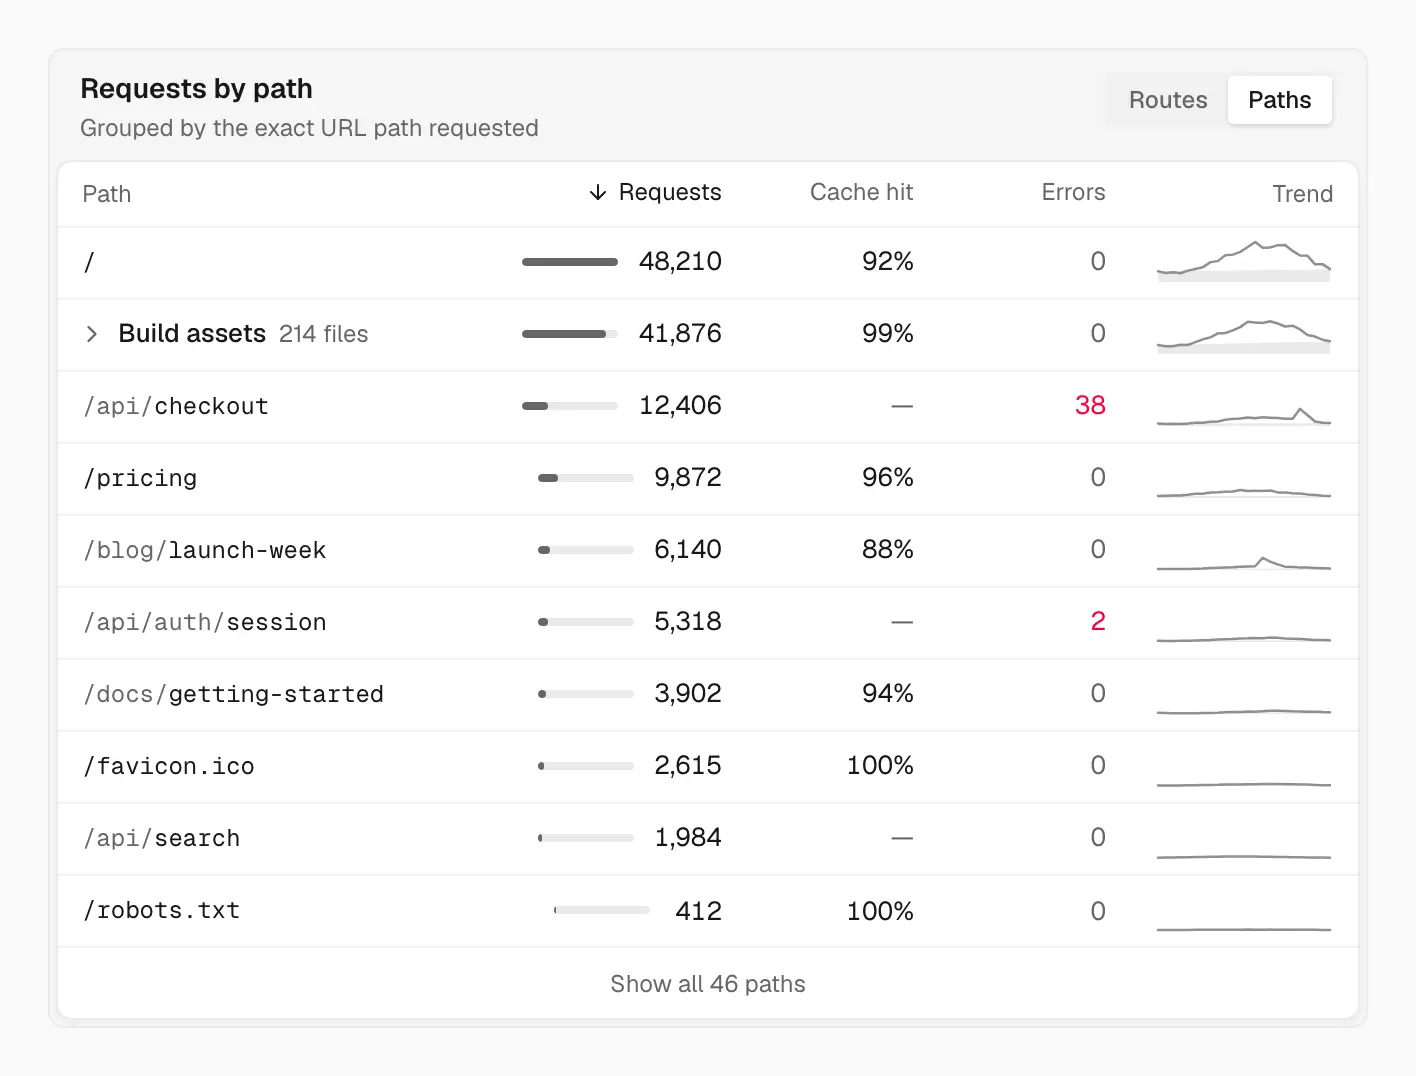
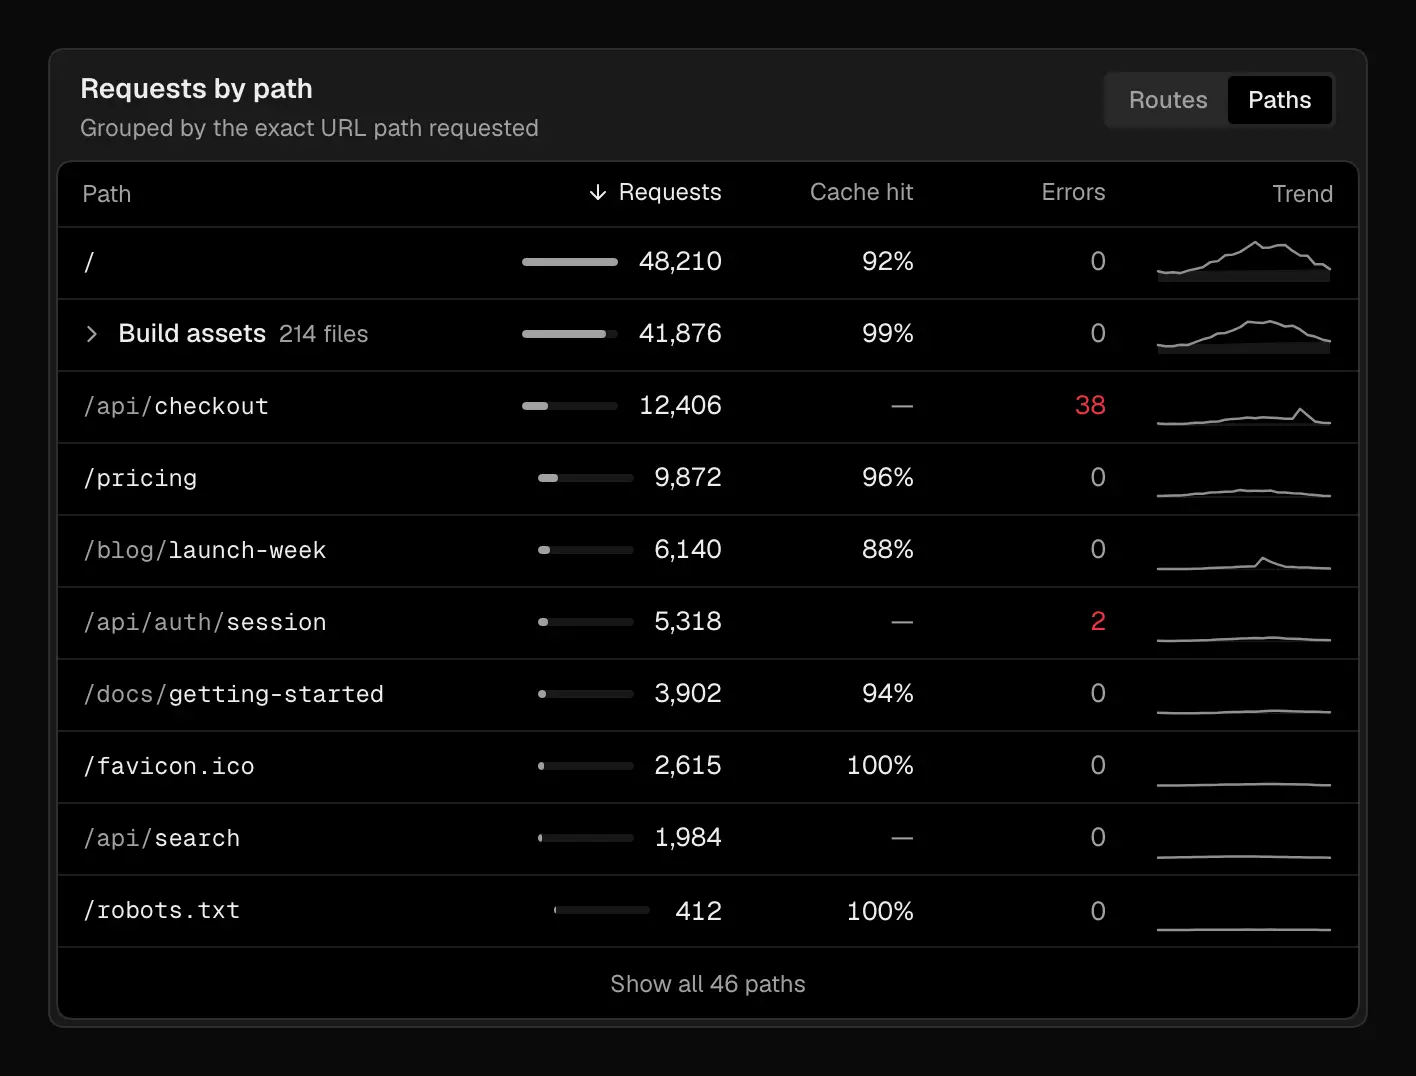
See which paths get the traffic, how well each one caches, and where the 5xx errors are
What each row shows
Switch between Routes, grouped by the route that handled each request, and Paths, grouped by the exact URL path. Each row shows:
- Requests: the count, with a bar showing its share against the busiest row
- Cache hit: the share of cacheable requests served from cache
- Errors: 5xx responses, highlighted when there are any
- Trend: a sparkline on a scale shared across rows, so you can compare them
Sort by Requests, Cache hit, or Errors. The table shows the top 10 rows, and you can expand it to every route or path.
Build assets in one row
Content-hashed files under /_next/static/ fold into a single Build assets row with their combined numbers, so they don’t push your routes down the list. Expand the row to see each file.
Clearer empty charts
When a chart has no data in the selected range, including function charts whose series are all empty, it shows a placeholder with a short message instead of an empty plot.
See Metrics for every chart in Observability.