Span details and error jump in request traces
 Sean DubbFounder, Easel.sh
You can read a span’s details next to the trace instead of in a popover, see which kinds of spans a request has, and jump straight to the span where it failed.
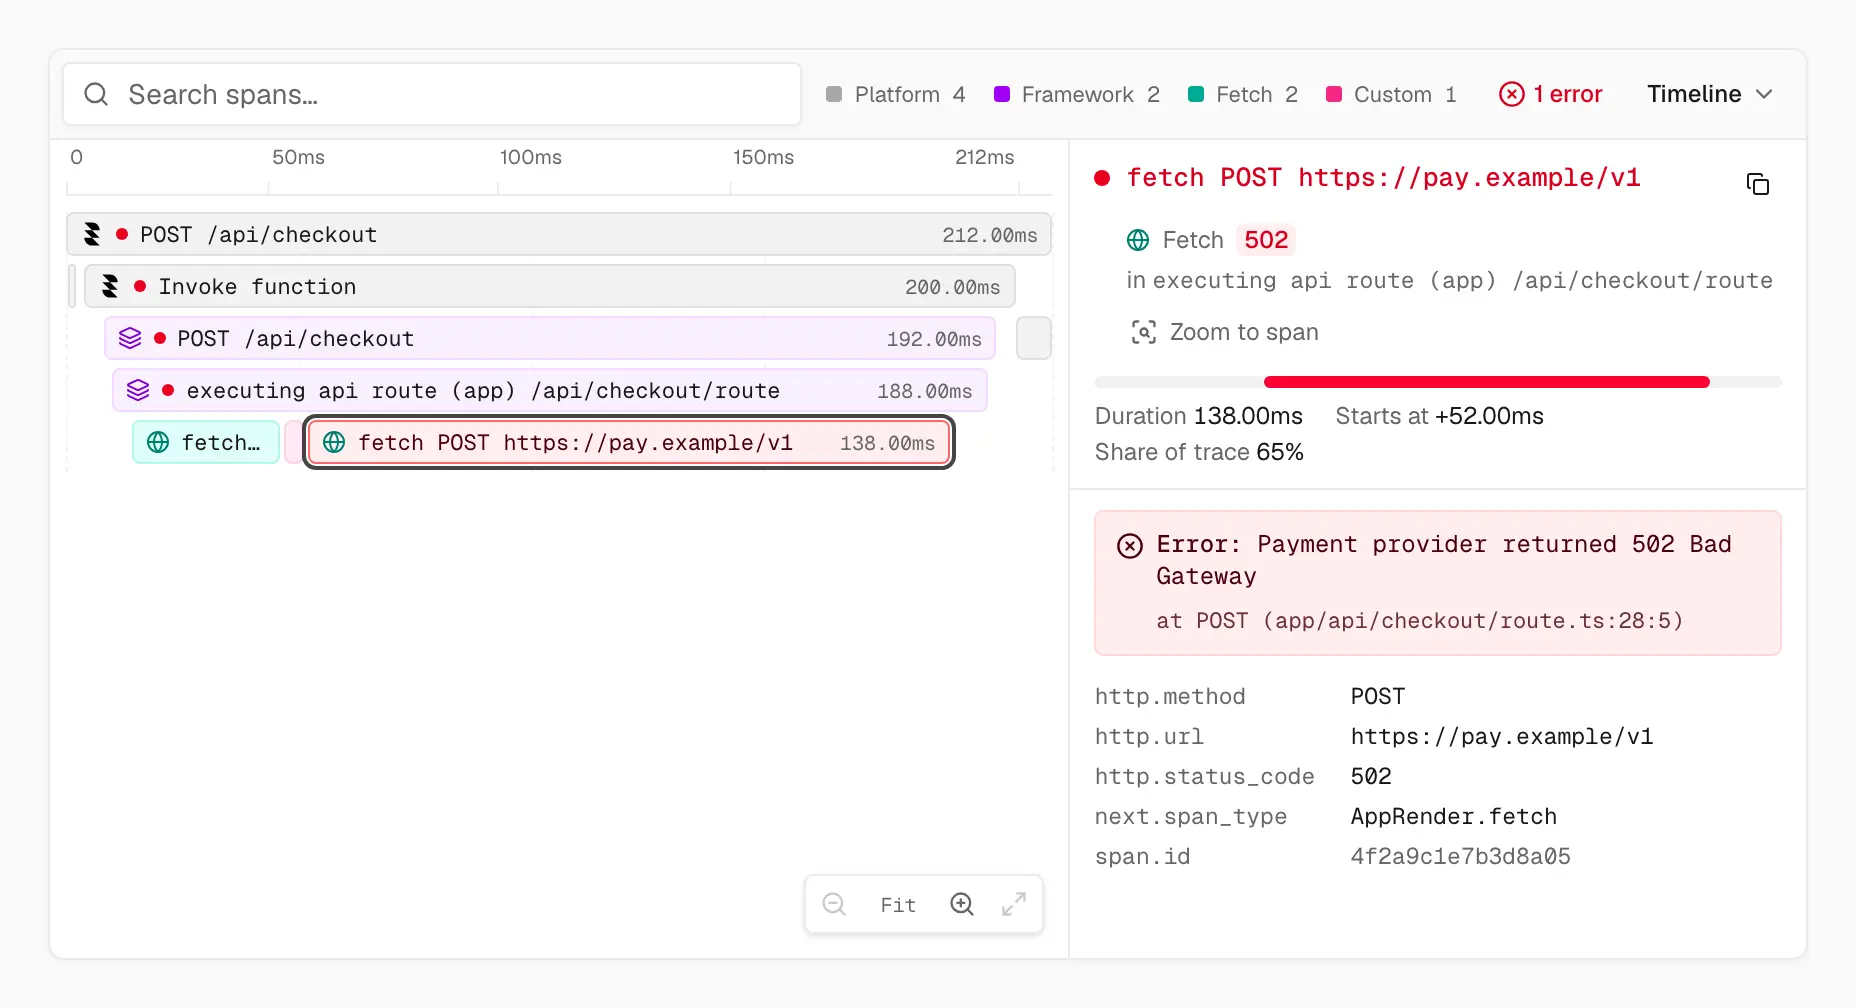
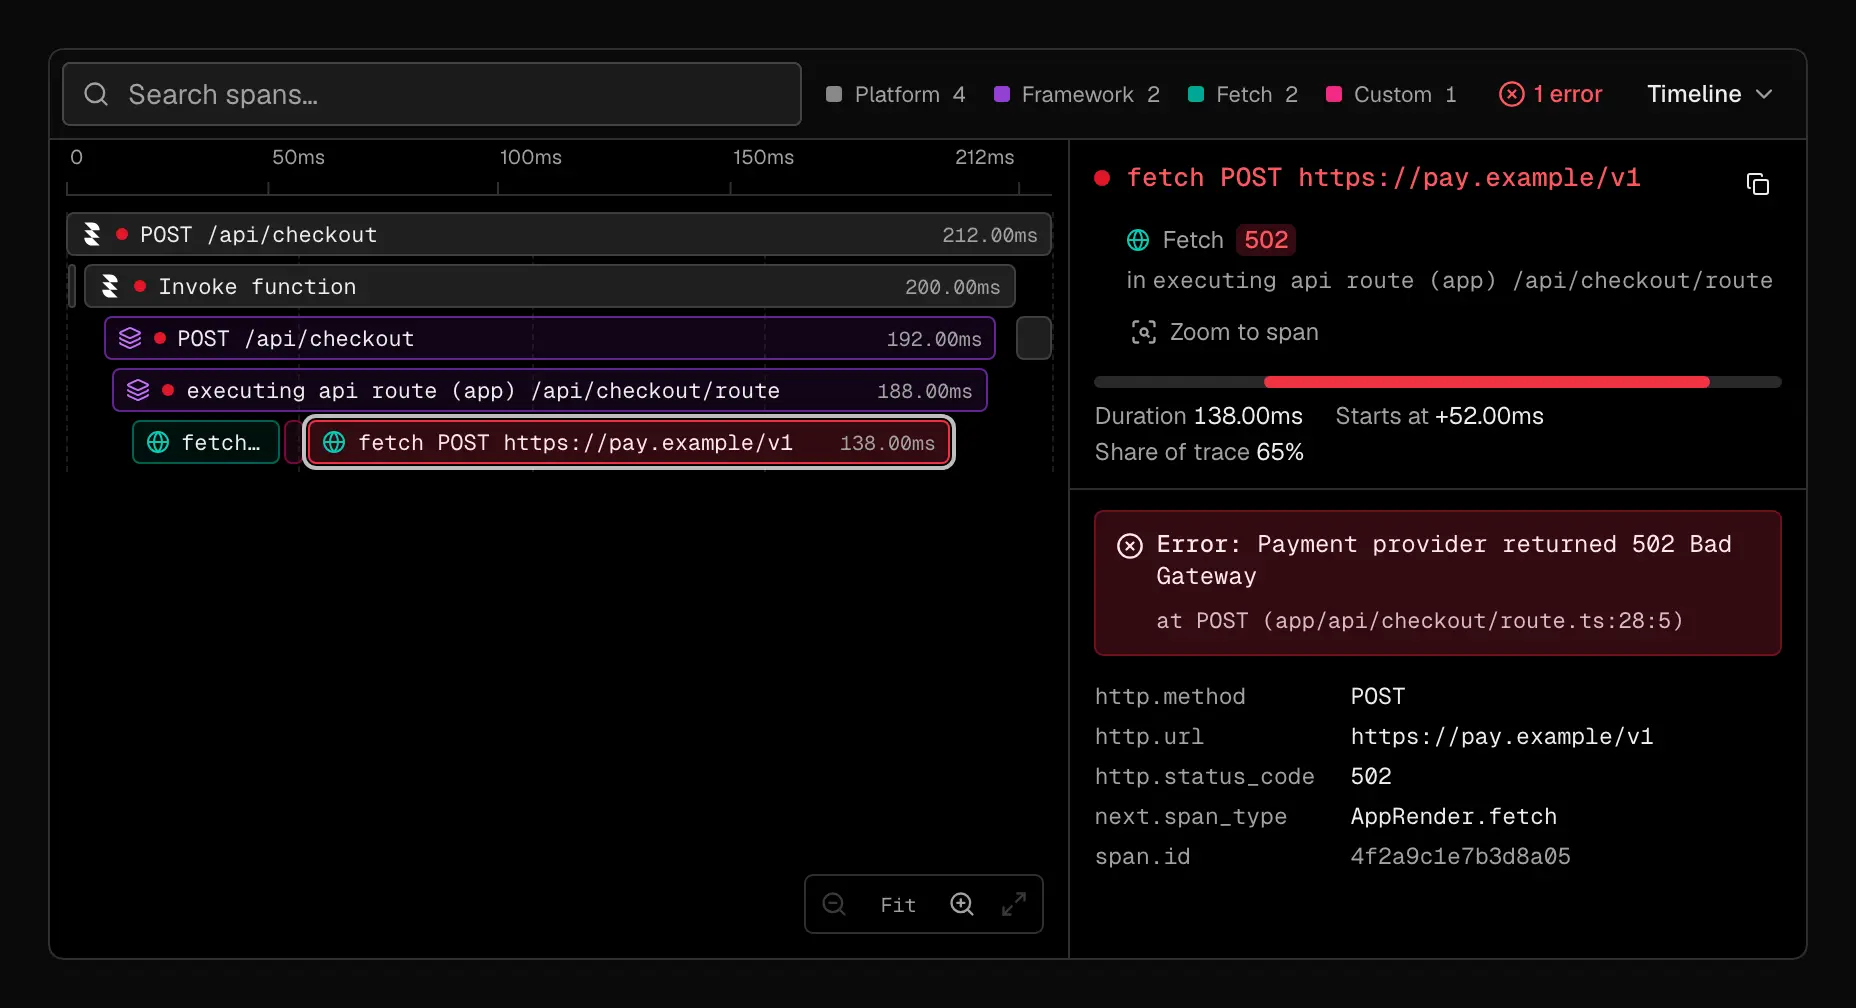
The trace opens on the span where the request failed, with its details beside the timeline
Span details pane
Select a span in Timeline, Tree, or Waterfall and its details open in a side pane. The pane shows:
- The span’s kind and its parent span
- Duration, Starts at, Share of trace, and Children
- Exception type, message, and stack trace when the span failed
- Every other span attribute
When the panel is wide enough, the trace stays in view so you can step from span to span. In a narrow panel, the details cover the trace, and pressing Esc takes you back.
Span kind legend
The trace toolbar lists the span kinds in the request, such as Platform, Framework, Fetch, and Custom, with a count for each. Hover a kind to pick its spans out of the trace.
Jump to the error
When a request has failed spans, the toolbar shows an N errors button, such as 1 error. Choose it to select the span where the request failed and open its details.
See Tracing.