Request traces in Logs
 Sean DubbFounder, Easel.sh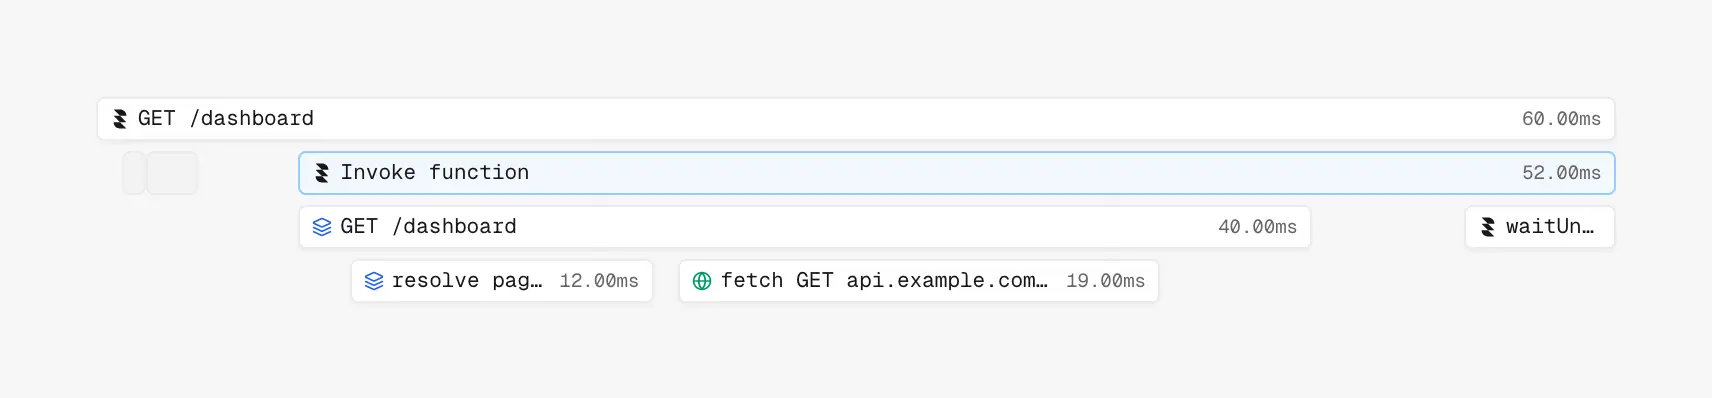
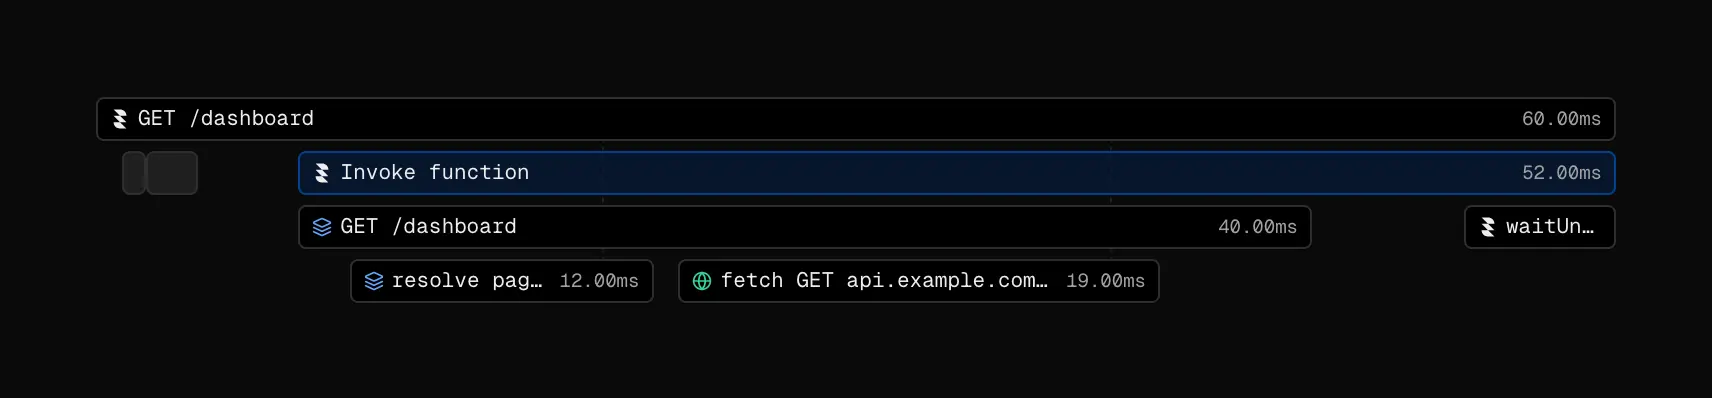
Request Trace timeline for a single request in Logs
Open a request in Logs and switch to the Trace tab to see the span tree for that request. You stay in the dashboard and do not need an external tracer.
What a request Trace shows
Each Trace builds a span tree for the selected request. Platform spans cover edge work such as Resolve Deployment and Resolve Route, then Invoke middleware and Invoke function. When your function emits OpenTelemetry (OTEL) spans, they nest under the invoke so app work sits next to platform timing.
Views share the same data:
- Timeline: absolute-time lanes with zoom
- Tree: hierarchy you can expand and collapse
- Waterfall: indented labels with duration bars
Cold start and AWS billed duration stay on the request detail panel so you can compare wall time, compute, and what you pay for after a release.
How to open a Trace
- Go to project Logs.
- Filter to the window and path you care about.
- Select a request row.
- Open the Trace tab in the dock (next to Logs).
- Switch among Timeline, Tree, and Waterfall as needed.
Use Traces when latency charts move and you need the span breakdown for one request. For the same function invoke across multiplexed requests, open Invocations and use its Trace tab for the invocation-level view.